Cargando...
Recursos educativos
-
Nivel educativo
-
Competencias
-
Tipología
-
Idioma
-
Tipo de medio
-
Tipo de actividad
-
Destinatarios
-
Tipo de audiencia
-
Creador
Lo más buscado
-

Match. Income and migration
EduBook Organización
- 2565 visitas
Look at the graph and answer the questions: How has the gross national income per person in LEDCs and MEDCs changed? How does this relate to migration?
-

Interpret. A continental climate landscape
EduBook Organización
- 2474 visitas
Look at the climate graph and the photograph and explain what effect the abundant rainfall of this climate has on the landscape.
-

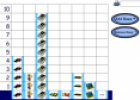
My favourite toy
TESiboard Organización
- 3659 visitas
With this online tool we can see what are our favourite toys. We complete the pictogram and print it. We interpret graph and data.
-

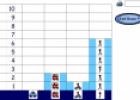
How I get to school
TESiboard Organización
- 3018 visitas
With this online tool we can see what are our ways of travelling to school. We complete the pictogram and print it. We interpret graph and data.
-

Look and answer. Conflict-related deaths 1990-2007
EduBook Organización
- 2091 visitas
Look at the graph and answer the questions: What percentage of the conflict-related deaths happened in Europe? Which continent has the highest percentage of conflict-related deaths?
-

Interpret. Electricity production 02
EduBook Organización
- 2071 visitas
Look at the graph and do the activity: Compare the evolution of the different sources used to produce electricity. Which one will be consumed most in the future?
-

Interpret. Electricity production 01
EduBook Organización
- 1918 visitas
Look at the graph and answer the question: How do you think geographical and economic factors influence the amount of electricity a country produces?
-

Look and answer. Workers employed in the tertiary sector in Spain in 2007
EduBook Organización
- 1862 visitas
Look at the graph and answer the questions: What percentage of workers in the service sector is employed in commerce? And in hotels and restaurants?
-

Interpret. Hot climate landscapes 02
EduBook Organización
- 1720 visitas
Look at the climate graph for Manila (Philippines) and do the activity: Compare the characteristics of the equatorial and tropical climates in terms of temperature and precipitation.
-

Look and Answer. Life expectancy by sex in Spain
EduBook Organización
- 1675 visitas
Look at the graph and answer the questions: How has life expectancy in Spain changed since 1900? Who has the higher life expectancy, men or women?
Te estamos redirigiendo a la ficha del libro...


